Understanding the Concept of Swing Trading
Swing trading is a trading approach that seeks to capture short- to medium-term price movements in financial markets. Positions are typically held for several days to a few weeks, allowing traders to benefit from price “swings” that occur within broader market trends. Unlike day trading, which involves opening and closing positions within the same trading session, swing trading allows more flexibility in time management while still aiming to generate active returns.
The method can be applied to various financial instruments, including stocks, exchange-traded funds (ETFs), forex, commodities, and cryptocurrencies. Swing traders rely primarily on price action, technical indicators, and chart patterns to identify entry and exit points. While fundamental analysis may inform the broader market bias, most swing trading decisions are driven by technical frameworks. The focus is not on predicting long-term economic outcomes but on identifying repeatable price behaviors that offer measurable risk and reward parameters.
At its core, swing trading recognizes that markets move in waves. Even within sustained bull or bear markets, prices advance and retreat in smaller cycles. By analyzing these incremental movements, traders aim to participate in segments of a trend without committing capital for extended investment horizons. This intermediate time frame distinguishes swing trading from both long-term investing and short-term scalping.
Market Structure and Price Movements
Financial markets move in cycles due to shifts in supply and demand. These cycles consist of expansion phases, where prices trend upward or downward, and consolidation phases, where prices fluctuate within a defined range. Swing traders attempt to capture profit during expansion phases and, in some cases, by trading within well-defined ranges where price oscillates between support and resistance.
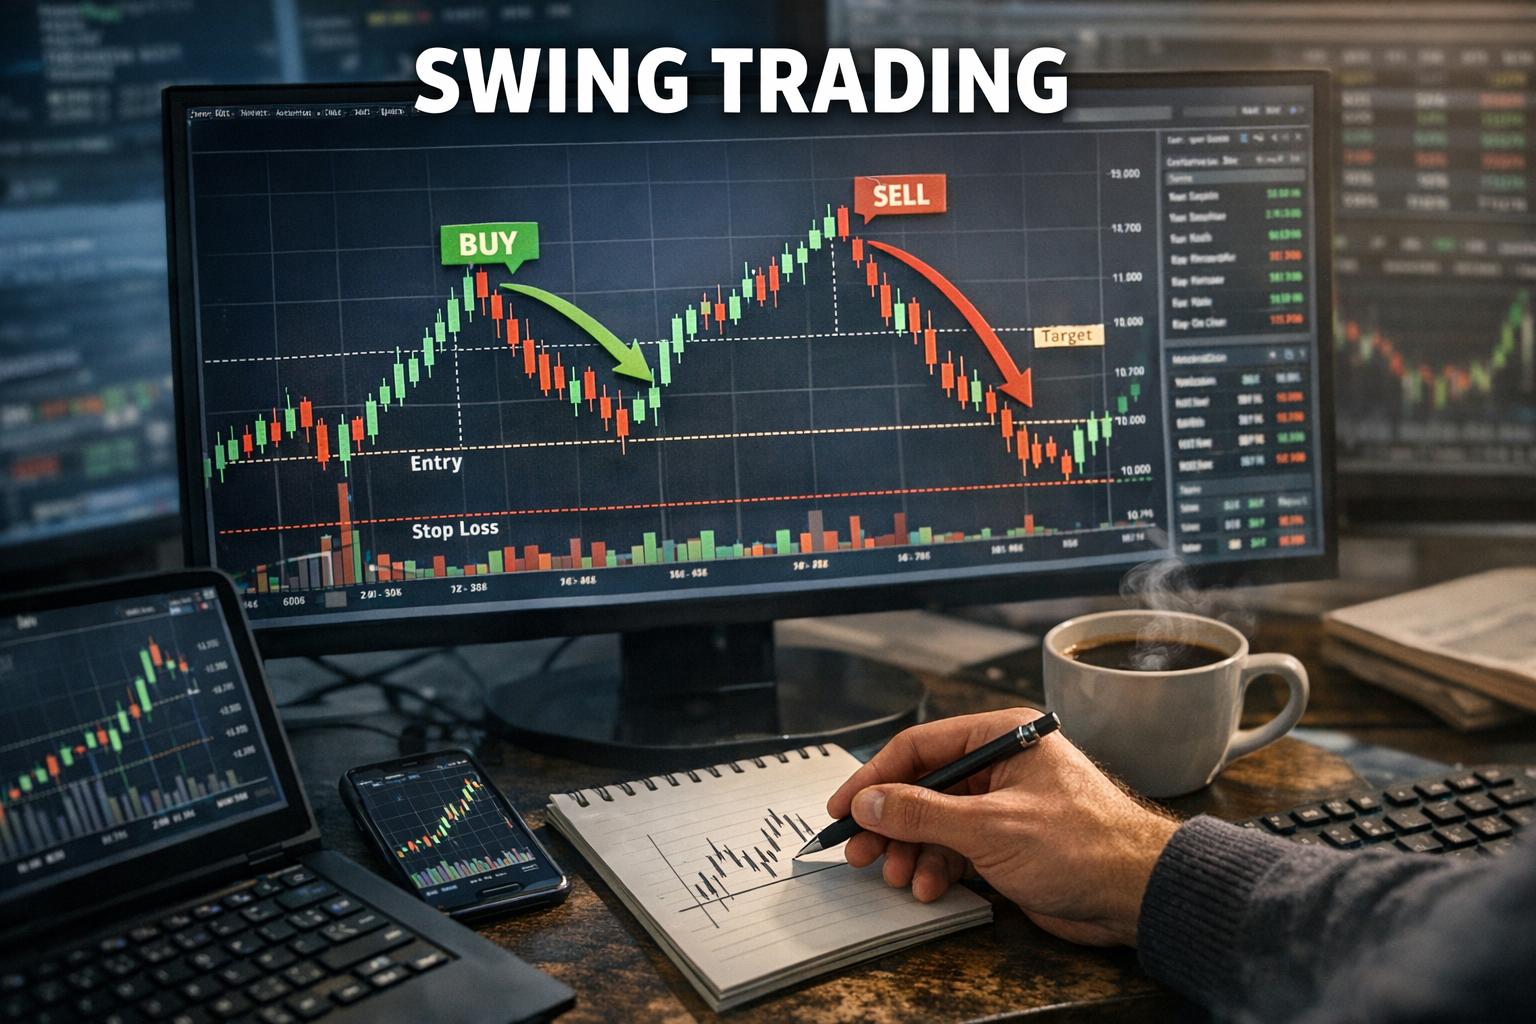
Markets rarely move in a straight line. Even in strong trends, prices retrace before continuing in the primary direction. These retracements form the basis of many swing trading setups. In an uptrend defined by higher highs and higher lows, a temporary pullback toward a support level may present a buying opportunity. Conversely, during a downtrend characterized by lower highs and lower lows, a short-term rally toward resistance can provide a selling opportunity.
Understanding market structure is essential. Trend identification often begins with examining swing highs and swing lows. When price consistently forms higher swing lows, buyers are generally absorbing selling pressure. When lower highs dominate, sellers tend to control rallies. This structural analysis helps traders avoid taking positions against prevailing momentum without a valid reversal signal.
Volume also contributes to market structure analysis. Increasing volume during breakouts suggests broader participation, which may enhance the durability of a move. Declining volume during pullbacks may indicate temporary profit-taking rather than a structural trend reversal. While volume data is more transparent in equity markets than in decentralized markets like forex, it remains a valuable contextual tool.
Time Frames in Swing Trading
The choice of time frame significantly influences trading decisions. Swing traders commonly use daily charts to determine overall direction, while four-hour or hourly charts help refine entries. This multi-timeframe analysis provides a structured method to align short-term opportunities with the broader market trend.
For example, a trader might identify a strong uptrend on a weekly chart, observe a pullback to support on the daily chart, and then use a four-hour chart to pinpoint a bullish reversal pattern. This layered approach reduces the likelihood of entering trades that conflict with the dominant trend.
Shorter time frames produce more frequent signals but may increase sensitivity to market noise. Minor fluctuations that appear significant on an hourly chart may be irrelevant when viewed from a daily perspective. Longer time frames typically yield fewer signals but may offer higher-quality setups with clearer structural patterns. The appropriate balance depends on capital constraints, availability for monitoring positions, and tolerance for short-term variability.
The duration of a swing trade is flexible. Some trades may last three to five days, while others extend several weeks if the trend persists. Rather than adhering to a predetermined holding period, many swing traders exit based on technical criteria such as trend breaks, momentum shifts, or the attainment of predefined profit targets.
Technical Analysis as a Core Tool
Technical analysis forms the foundation of most swing trading strategies. It involves studying historical price data to identify patterns and statistical tendencies. The underlying premise is that price reflects collective market sentiment and that recurring formations can offer probabilistic insight into future behavior.
Trendlines are among the simplest tools. By connecting sequential higher lows in an uptrend or lower highs in a downtrend, traders visualize directional bias. A break below an established trendline may indicate weakening momentum and prompt closer evaluation of open positions.
Moving averages smooth price fluctuations to reveal the underlying trend. A common configuration uses a short-term moving average, such as the 20-day, alongside a longer-term average like the 50-day or 200-day. Crossovers between these averages may signal changes in directional momentum. When a short-term average crosses above a longer-term one, it can reflect strengthening bullish conditions. However, moving averages are lagging indicators and should be interpreted within broader market context.
Support and resistance represent areas where price historically reversed or paused. These levels emerge from prior concentration of buying or selling activity. When price revisits such zones, traders observe how market participants respond. Rejection at resistance in a downtrend or stabilization at support in an uptrend may provide structured entry points.
Price action itself remains central. Candlestick formations such as engulfing patterns, pin bars, and inside bars can reveal short-term shifts in control between buyers and sellers. Swing traders often combine these formations with horizontal levels to increase signal reliability.
Momentum and Oscillators
Momentum indicators measure the speed and strength of price movement. Tools such as the Relative Strength Index (RSI), Moving Average Convergence Divergence (MACD), and stochastic oscillator assist traders in evaluating whether price movement is accelerating or decelerating.
RSI values above 70 often indicate overbought conditions, while readings below 30 suggest oversold conditions. In range-bound markets, these thresholds may provide reversal signals near established boundaries. In trending markets, however, oscillators can remain elevated or depressed for extended periods. For this reason, swing traders generally use oscillators to complement trend analysis rather than to counteract it.
MACD analyzes the relationship between two moving averages and illustrates momentum via histogram expansion or contraction. A bullish crossover occurring above the zero line often reflects strengthening upward momentum within an established uptrend. Divergence between price and MACD may signal weakening trend strength, prompting tighter risk management.
Stochastic oscillators compare closing prices to a defined price range over a specific period. This comparison can help identify potential turning points during retracements. As with other tools, confirmation from additional indicators or structural analysis improves robustness.
Chart Patterns and Price Formations
Chart patterns reflect recurring formations that emerge from collective behavioral tendencies. These formations often signal potential continuation or reversal of existing trends. Recognizing them requires consistent exposure to chart data and objective criteria for validation.
A double bottom pattern forms when price tests a support level twice without breaking lower, suggesting diminishing selling pressure. Confirmation typically occurs when price breaks above the intermediate high between the two lows. The projected price objective may approximate the height of the pattern added to the breakout level.
The head and shoulders pattern consists of three peaks, with the middle peak higher than the others. A break below the neckline often signals a transition from bullish to bearish conditions. Inverse head and shoulders patterns reflect the opposite dynamic and may indicate bullish reversals.
Continuation formations such as flags, pennants, and triangles often appear after strong directional moves. These patterns represent temporary pauses where the market consolidates before resuming its prior course. Swing traders typically wait for breakout confirmation accompanied by increased trading activity before establishing positions.
Pattern reliability varies with overall market context. A bullish pattern occurring within a strong downtrend may carry less probability than one aligned with higher time frame direction. Contextual alignment remains central to disciplined execution.
Risk Management Principles
Effective risk management underpins sustainable swing trading. Since no strategy guarantees success, capital preservation remains a primary objective. Position sizing should reflect account equity and predefined tolerance for loss.
Many traders limit exposure to one or two percent of total capital per trade. This constraint allows multiple attempts without significant deterioration of account value. Stop-loss orders define the price level at which the original trade premise becomes invalid. In a long trade initiated at support, the stop may be placed below the recent swing low or beneath a structural support zone.
Assessing the risk-to-reward ratio before entry provides clarity. If potential profit does not adequately exceed the defined risk, the trade may not justify execution. Maintaining favorable ratios over time helps compensate for inevitable losing trades. Consistency in applying these principles often differentiates systematic traders from inconsistent participants.
Trailing stops offer an additional mechanism for risk control. By adjusting the stop level as price advances, traders can protect accrued gains while allowing room for continued movement. The adjustment method may follow a moving average, percentage threshold, or structural pivot.
Trade Planning and Execution
A structured trading plan outlines entry triggers, exit criteria, and capital allocation rules. Developing written guidelines promotes consistency and facilitates performance review. Without predefined criteria, decisions may be influenced by short-term volatility rather than strategic intent.
Execution methods vary according to liquidity and volatility. Market orders ensure immediate entry but may result in slippage during rapid price changes. Limit orders provide price control but risk non-execution if the market does not retrace to the desired level. Swing traders often assess prevailing market conditions before selecting order types.
Profit targets may align with prior resistance levels, measured move projections, or technical extension tools such as Fibonacci ratios. Some traders close partial positions at interim levels while allowing the remainder to run, balancing realized gains with continued exposure. Clear documentation of each step improves accountability and strategic refinement.
Fundamental Considerations
Although technical analysis is central to swing trading, fundamental factors often shape the environment in which price patterns unfold. Corporate earnings releases, interest rate decisions, inflation statistics, and geopolitical events can alter volatility and trend direction.
Equity traders monitor earnings calendars to avoid unforeseen price gaps. Holding positions through major announcements introduces uncertainty, as price may open significantly above or below the previous close. Some traders adjust position sizes or temporarily close trades ahead of scheduled events.
In currency markets, central bank communication influences expectations regarding monetary policy. Commodity prices respond to supply disruptions, weather patterns, and macroeconomic demand. While swing traders may not conduct deep fundamental modeling, awareness of these drivers contextualizes technical signals and reduces surprise exposure.
Psychological Discipline
Trading psychology influences execution quality and long-term consistency. Emotional reactions to gains or losses can prompt deviation from established plans. Maintaining discipline involves adhering to predefined criteria regardless of recent outcomes.
Patience is integral. High-probability setups may appear infrequently, and forcing trades outside established parameters can impair performance metrics. Accepting periods of inactivity as part of the process reduces unnecessary turnover.
Maintaining a trading journal supports reflective practice. Documenting rationale, entry conditions, exit decisions, and post-trade evaluation generates data for performance analysis. Over time, patterns of strength and weakness become clearer, enabling targeted adjustments.
Advantages of Swing Trading
Swing trading presents several structural benefits compared to other active styles. The multi-day holding period reduces the need for continuous screen monitoring, which may suit individuals balancing other professional responsibilities. Compared to intraday strategies, transaction frequency is lower, potentially reducing commission expenses and execution fatigue.
By focusing on broader price swings, traders may avoid reacting to minor intraday fluctuations. The strategy also allows participation in both upward and downward market movements, offering flexibility across varying macroeconomic conditions.
The analytical framework is adaptable across asset classes. While execution mechanics differ among equities, forex, and digital assets, the core principles of trend recognition, momentum assessment, and risk management remain consistent.
Limitations and Risks
Despite its practical advantages, swing trading carries inherent risks. Overnight and weekend exposure may result in price gaps that exceed anticipated stop levels. In leveraged accounts, such gaps can materially affect capital.
Choppy or range-bound markets can generate false breakouts and whipsaws. Frequent minor losses during such periods may erode confidence and profitability. Adjusting trade frequency or narrowing focus to instruments exhibiting clearer structure may mitigate this challenge.
Over-optimization of indicators presents another limitation. Excessive reliance on multiple overlapping signals may complicate decision-making without improving predictive power. Maintaining simplicity often enhances clarity and execution discipline.
Technology and Analytical Tools
Modern brokerage platforms provide charting software, customizable indicators, and integrated order management systems. Screeners allow traders to filter securities based on criteria such as volatility thresholds, trend alignment, or earnings momentum.
Backtesting tools enable evaluation of strategy performance using historical data. While historical analysis does not guarantee future success, it can reveal how a strategy behaved under different volatility regimes. Combining quantitative review with forward testing in simulated environments strengthens preparation.
Performance analytics dashboards help monitor win rate, average reward-to-risk ratio, and maximum drawdown. These metrics offer objective insight into strengths and weaknesses, guiding incremental refinement.
Strategy Development and Adaptation
Developing a swing trading methodology requires clearly defined entry triggers, exit signals, and capital allocation parameters. Strategies may focus on trend continuation, breakout confirmation, pullback entries, or mean reversion within established ranges. Consistency in application allows for measurable evaluation.
Periodic review is essential because market behavior evolves. Structural changes such as algorithmic participation, regulatory reforms, or macroeconomic transitions can alter volatility dynamics. Ongoing analysis ensures that strategic assumptions remain aligned with prevailing conditions.
Diversification across sectors or asset classes may reduce exposure to isolated risks. However, maintaining comprehensibility of each position remains important. Concentrating on a manageable watchlist often improves situational awareness and analytical depth.
Regulatory and Capital Requirements
Brokerage regulations differ by jurisdiction and affect trading processes. Margin accounts permit leveraged exposure, amplifying both profits and losses. Understanding maintenance requirements and potential margin calls is critical before employing leverage.
Tax treatment of short-term gains may differ from long-term investment income. Accurate record-keeping supports compliance and accurate performance calculation. Transaction costs, including spreads and financing charges, should be integrated into expected return assessments.
Conclusion
Swing trading represents a structured method for engaging with intermediate price movements across financial markets. By integrating technical analysis, contextual awareness of fundamentals, and disciplined risk management, traders seek to capture recurring market behavior within defined parameters.
Although uncertainty remains inherent in speculative markets, a systematic plan, prudent capital allocation, and continuous evaluation can enhance decision quality. Swing trading offers a balanced framework for active market participation without the constant demands of intraday strategies, provided that risk controls and disciplined execution remain central to the process.